
Civis Analytics fielded a survey with 10,382 national respondents on January 13–18, 2022. Below are some key takeaways from this wave’s research.
National Highlights
Nationally, concern about Coronavirus has increased since our last wave of research in October. 34.8% of adults report being ‘very concerned’ about COVID-19, compared to 33.1% in our last wave of research in October. With regard to the global state of the pandemic, 30.6% of US adults say they are ‘very concerned’ about the current situation in other countries, down from 31.9% in October. 85.8% of US adults report having heard of Coronavirus variants or strains (e.g. Alpha, Beta, Gamma, Delta, Omicron), with 40.0% of those respondents reporting being ‘very concerned’ about the variants, up from our last wave of research by 3.2%.
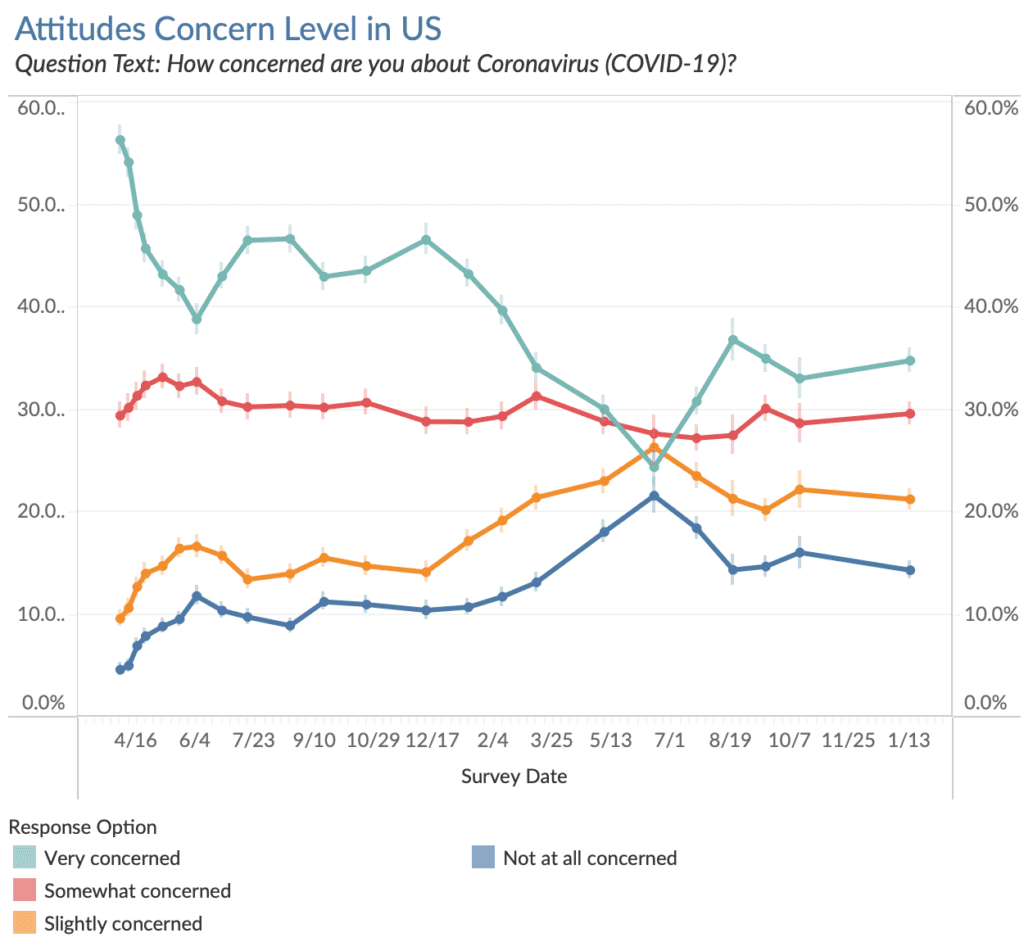
Reported levels of concern about COVID-19 among US adults have slightly increased since our last wave of research in October.
Nationally, 69.5% of adults report that they have received at least one dose of the COVID-19 vaccine, a 2.6pp increase since our last wave of research in October (66.9%). 91.8% of US adults who have received at least one dose report having also received a second dose of the COVID-19 vaccine, compared to 89.2% in October. 58.7% of US adults who’ve received at least one dose of the COVID-19 vaccine report that they have received a COVID-19 booster. Of those that have not received a booster shot, 41.9% report that they would be ‘very likely’ to get a COVID-19 booster shot. Among US adults who have not yet been vaccinated, 17.2% (21.2% in October) say they are ‘very’ or ‘somewhat likely’ to get vaccinated for COVID-19, while 66.9% (60.9% in October) say they are ‘very’ or ‘somewhat unlikely’, and 15.8% (18.0% in October) are not sure.
In the last 30 days, 31.6% of US adults report feeling more confident in the protection the vaccine provides and 25.5% of US adults report feeling less confident in the protection of the vaccine. 25.6% of US adults are ‘very concerned’ about the protection of the COVID-19 vaccine wearing off, very similar to the 24.8% in October. 11.4% believe it will wear off in one month, 14.2% in three months, 31.5% in six months, 21.6% in one year, and 21.3% believe it will wear off in more than one year.
US Margin of Error = 1.5%
| Response (% selected) | US | CA | FL | NY | OH | TN | TX | WA |
| Yes | 58.7% | 65.1% | 57.0% | 65.0% | 65.7% | 52.4% | 54.4% | 57.8% |
| No | 41.3% | 34.9% | 43.0% | 35.0% | 34.3% | 47.6% | 45.6% | 42.2% |
Over the past few months, some states and jurisdictions have returned to mask mandates and social distancing measures following an increase in COVID-19 cases. 58.3% of US adults report always wearing a mask indoors, up from our last wave of research by 3.4%, and 44.9% report always staying 6 feet apart from others while indoors. Nationally, 40.9% of adults report always staying home and limiting trips to essentials, 41.2% report only gathering in small groups when socializing, and 31.8% report getting tested for Coronavirus when experiencing symptoms or planning to travel. Of US adults who report ‘always’ wearing a mask indoors, 55.6% say they do so because they ‘want to help protect others who have health issues or cannot be vaccinated’, 54.4% report they ‘don’t trust that others are vaccinated or safe to be around unmasked’, and 44.9% report they wear masks indoors because ‘It is required in the public places [they] go to’. 14.5% of US adults ‘always’ encounter vaccine requirements to enter restaurants and entertainment venues, 27.1% ‘sometimes’ encounter vaccine requirements, 19.3% ‘rarely’ encounter vaccine requirements, and 39.1% ‘never’ encounter vaccine requirements for entry.
With cases surging, rapid tests have been an increasingly popular mode of convenient COVID-19 testing. 17.2% of US adults said they have purchased rapid tests in the last month. 34.2% said they were not interested in purchasing rapid tests, 11.5% said they couldn’t find any available, 6.6% said they thought they were too expensive, and 30.6% said they did not purchase rapid tests due to another reason.
Parents or guardians of children 18 years old or younger differ in their plans to vaccinate their child(ren) against COVID-19 across age groups. Everyone over the age of 5 in all 50 states is eligible for a COVID-19 vaccine. Among US parents, 38.2% of those with children 0 to 6 months old and 44.5% of those with children 6 months to 4 years old report being ‘very’ or ‘somewhat likely’ to get those child(ren) vaccinated when it is available. 44.9% of US parents with 5 to 11 year olds report that those child(ren) have received at least one dose of a COVID-19 vaccine. Of US parents with 5 to 11 year olds who haven’t received the vaccine yet, 31.0% say they are ‘very’ or ‘somewhat likely’ to get their child(ren) in that age group vaccinated. 56.7% of US parents with 12 to 15 year olds report that those child(ren) have received at least one dose of a COVID-19 vaccine, compared to 60.5% in October. Of US parents with 12 to 15 year olds who haven’t received the vaccine yet, 28.7% say they are ‘very’ or ‘somewhat likely’ to get their child(ren) in that age group vaccinated. 65.0% of US parents with 16 to 18 year olds report that those child(ren) have received at least one dose of a COVID-19 vaccine, compared to 66.0% in October. Of US parents with 16 to 18 year olds who haven’t received the vaccine yet, 20.8% say they are ‘very’ or ‘somewhat likely’ to get their child(ren) in that age group vaccinated.
Everyone over the age of 12 in all 50 states is eligible for a COVID-19 booster. 64.7% of US parents with 12 to 15 year olds report that those child(ren) have received a COVID-19 booster. Of US parents with 12 to 15 year olds who haven’t received the booster yet, 70.4% say they are ‘very’ or ‘somewhat likely’ to get their child(ren) in that age group boosted. 61.9% of US parents with 16 to 18 year olds report that those child(ren) have received a COVID-19 booster. Of US parents with 16 to 18 year olds who haven’t received the booster yet, 71.0% say they are ‘very’ or ‘somewhat likely’ to get their child(ren) in that age group boosted.
Parents or guardians of children 18 years old or younger have similar reported levels of using COVID-19 testing across age groups. In the last 30 days, 26.3% of parents with child(ren) ages 0 to 6 months old report getting their child(ren) tested for COVID-19, compared to 31.5% with child(ren) ages 6 months to 4 years old, 37.1% 5 to 11 years old, 37.8% 12 to 15 years old, and 35.5% 16 to 18 years old. Of parents who report having tested their child(ren) for COVID-19 in the past 30 days, 35.4% report their 0 to 6 months old child(ren) tested positive, compared to 37.0% with child(ren) ages 6 months to 4 years old, 33.6% 5 to 11 years old, 31.3% 12 to 15 years old, and 26.5% 16 to 18 years old.
The school year is about halfway complete for many primary and secondary schools. 54.7% of US adults with child(ren) who are currently enrolled in primary or secondary school report being ‘strongly’ or ‘somewhat’ in favor of schools mandating COVID-19 vaccination for eligible age groups in order to return to in person classes. When asked if their child(ren)’s primary or secondary schools are mandating the COVID-19 vaccine for eligible age groups, 27.9% of elementary school parents report that one or more of their child(ren)’s schools are mandating the vaccine, similar to 23.4% for middle school parents and 26.0% for high school parents.
US Margin of Error = 2.6%
| Response (% selected) | US | CA | FL | NY | OH | TN | TX | WA |
| Strongly Agree | 33.8% | 44.8% | 33.2% | 51.9% | 28.8% | 25.4% | 33.6% | 36.8% |
| Somewhat Agree | 20.9% | 25.7% | 20.6% | 20.9% | 18.7% | 14.8% | 25.3% | 22.3% |
| Somewhat Disagree | 10.2% | 5.8% | 13.2% | 5.5% | 6.6% | 9.2% | 9.0% | 11.6% |
| Strongly Disagree | 27.4% | 16.4% | 28.6% | 17.0% | 40.3% | 36.1% | 30.2% | 23.6% |
| I don’t Know | 7.6% | 7.2% | 4.4% | 4.8% | 5.5% | 14.4% | 2.0% | 5.7% |
Among US parents with child(ren) enrolled in primary or secondary school, 44.1% report their school is mandating the COVID-19 vaccine for teachers, compared to 46.0% in October. 55.3% of US parents with child(ren) enrolled in primary or secondary school report that students, teachers, or other staff at their child(ren)’s school(s) have tested positive in the last 30 days, compared to 47.0% in October.
Many American colleges are also halfway through their school year. Of college students and college students’ parents, 69.3% indicate that they ‘strongly’ or ‘somewhat agree’ that colleges should mandate the COVID-19 vaccine for students prior to enrolling in classes. 49.0% of US college students or parents of college students report that the college they or their child is attending requires that students receive the COVID-19 vaccine, 31.3% report no mandate, and 19.6% are not sure if the vaccine is required.
17.1% of US adults report recently becoming unemployed or furloughed as a result of the COVID-19 pandemic. 31.8% of US adults who are not currently working report not currently being in the workforce (e.g. student, retired), and 22.0% report being unable to work due to family, medical, or other reasons. 56.0% of US adults report ‘somewhat’ or ‘strongly’ agreeing that employers should mandate the coronavirus (COVID-19) vaccine for employees returning to in-person work.
When asked about government budget priorities, 55.0% of US adults said they would increase federal spending for ‘health care’, 54.1% would increase federal spending for ‘veterans benefits’, and 53.6% would increase federal spending for ‘Social Security’. For state budgets, 58.8% of US adults said they would increase spending for ‘health care’, 49.3% would increase spending for ‘K-12 education’, and 45.4% would increase spending for ‘infrastructure like rebuilding highways and roads’. This year, increasing funding for ‘Coronavirus (COVID-19)’ did not make it into the top three items for increasing funding for federal or state budgets, whereas last year it was the top response for federal funding increase and the second highest response for state funding increase.
43.0% of US adults said that they would increase spending for K-12 education in the federal government budget, and 26.4% of US adults said they would increase spending for postsecondary education in the federal budget. Similarly, 49.3% of US adults said they would increase spending for K-12 education in their state’s government budget, and 30.8% of US adults said they would increase spending for postsecondary education in the state budget.
With the change in the CDC guidance for quarantining after testing positive from 10 days to 5 days, 17.0% of US adults ‘strongly agree’ with the new guidance and 16.7% of US adults ‘strongly disagree’. In addition, 10.2% of US adults think the government is ‘very prepared’ to handle the next pandemic, while 26.6% think the government is ‘very unprepared’.
54.8% of US adults reported that their holiday plans did not change this season. 34.6% said their holiday plans changed due to Covid and 10.6% said their holiday plans changed, but not because of Covid.
Responses were gathered through online web panels, quality screened, and weighted to accurately reflect the entire adult population of the US. Questions were fielded January 13–18, 2022 (10,382 respondents).
Deep dive analysis is available at a national level and starting in Wave 4, for certain states.
January 13–18, 2022: National | California | Florida | New York | Ohio | Tennessee | Texas | Washington
October 13–16, 2021: National
August 23–24, 2021: National
June 16-21, 2021: National
June 09-14, 2020: National | New York | Washington | Ohio
May 08-10, 2020: National | Florida | New York | Washington | Texas
April 23-26, 2020: National | Florida | New York | Washington
April 17-19, 2020: National
April 10-12, 2020: National
April 02-04, 2020: National
This data has been shared with the Understanding Coronavirus in America Study led by the USC Dornsife Center for Economic and Social Research.