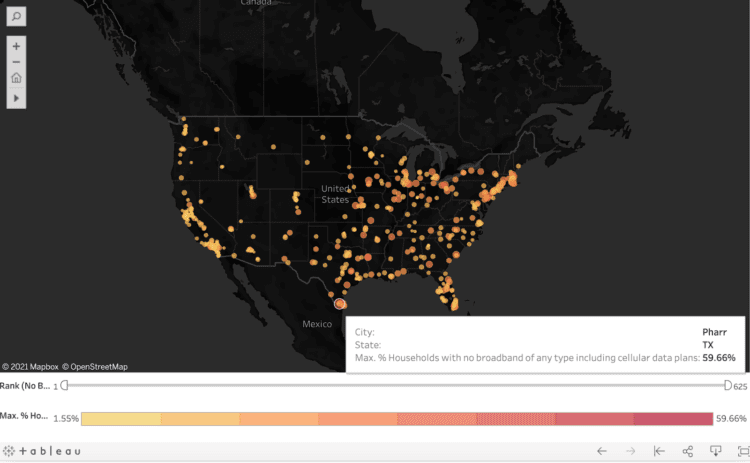
Skip to Main Content
Clare Epstein
Clare Epstein | VP, Public Sector, Civis Analytics

About 80 miles inland from the Gulf of Mexico, nestled between the Rio Grande River and the Mexican border, sits Pharr, Texas. Home to a fast-growing economy and a young, educated, overwhelmingly bilingual workforce, Pharr is a city on the rise, more than doubling its population over the last three decades to just shy of 80,000 residents.  

Connecting to Mexico from Pharr is quick and easy. The city serves as a regional hub for transportation, and the 3.2-mile-long Pharr-Reynosa International Bridge, which links the community to the Mexican city of Reynosa, Tamaulipas, touts the fastest commercial crossing time in the entire Lower Rio Grande Valley.

Connecting to high-speed internet from Pharr? That’s a different story.

In 2020, the National Digital Inclusion Alliance (NDIA) — a nonprofit organization that advocates for nationwide access to broadband service — placed Pharr atop its annual list of America’s Worst Connected Cities, a ranking informed by two key criteria: 

  • The percentage of households without wireline broadband subscriptions (defined as “broadband such as cable, fiber optic or DSL”) 
  • The percentage of households lacking broadband internet subscriptions of any type, including mobile data plans

The NDIA found that close to 60 percent of all Pharr households are not served by broadband access of any type — a higher percentage than any other U.S. city (see map visualization):

image-7

The NDIA collects the data that shapes the Least Connected Cities list from sources including the American Community Survey, the U.S. Census’ annual large-scale survey of American households, which since 2013 has included a series of questions on household computer ownership and internet access (referring to actual connections, not just availability). The NDIA list also relies on information from the Federal Communications Commission (FCC), which every six months compiles data from U.S. internet service providers through its mandatory Form 477 reporting process. The FCC website publishes localized Form 477 information in two forms: Census Tract Data on Internet Access Services and Broadband Deployment Data.

This data is not only essential to recognizing where broadband connectivity gaps exist, but also to pinpointing related socioeconomic factors that contribute to America’s digital divide, which the NDIA defines as “the gap between those who have affordable access, skills, and support to effectively engage online and those who do not.” 

President Biden’s $1.2 trillion Infrastructure Investment and Jobs Act vows to erase this gap, pledging $65 billion to expanding broadband availability nationwide. What additional data is required to ensure this $65 billion is spent where it’s most desperately needed, where do we get this data, and how do we use it to conquer digital inequity once and for all? 

How data defines the digital divide

Civis Analytics has identified five foundational datasets for recognizing where the digital divide exists and which factors separate the nation’s broadband haves from its have-nots:

  • Demographics data (e.g., race, age, income, education) 
  • Internet access data (i.e., whether or not a particular location is served by reliable, high-speed internet service)
  • Hardware data (whether users access the web via desktop, laptop, tablet, mobile phone, etc.) 
  • Cost data (whether high-speed access is affordably and competitively priced for all consumers) 
  • Digital literacy data (whether consumers know how to use connected devices, if they practice online safety, if they know where and how to register for subsidized broadband access, etc.)

Accurate, actionable data of this type is in short supply, however. As noted in the first blog in this series, experts can’t even agree on exactly how many Americans lack access to high-speed internet, with estimates ranging between 14 million and 157 million. Moreover, access data is just the tip of the information iceberg, experts say. 

“We often oversimplify the ‘digital divide’ and measure it by looking at broadband access and affordability. However, as essential infrastructure, broadband must be viewed through a digital, physical, and social lens, and thus requires the analysis of multiple metrics,” David Siegel, co-chairman at hedge fund Two Sigma and chairman at the Siegel Family Endowment, tells Protocol. “The most telling data points to understand the digital divide take into account the multidimensional nature of the factors that cause the divide: access, but also cost structures, digital literacy, governmental programs and incentives, relationships between technology companies and telecoms, and broader socioeconomic trends, among others.” 

There is a growing patchwork of informational resources to fill in some of these knowledge gaps. Siegel points to the Center on Rural Innovation, a nonprofit devoted to advancing inclusive rural prosperity, whose interactive map and data dashboard spotlights rural communities that are ripe for innovation, along with locations that are falling behind. 

Beyond the American Community Survey and the FCC’s Form 477 data collection efforts, federal data sources on broadband access also include the National Telecommunications and Information Administration’s Internet Use Survey, administered every other calendar year. The survey poses more than 50 detailed questions about computer and internet use to approximately 50,000 households across all 50 states and the District of Columbia, revealing which devices and technologies Americans use to access the internet, where they go and what they do online, and which factors prevent them from taking full advantage of digital information and services. 

Local-level resources can be equally illuminating. For example, the previous blog in this series noted that schools have uniquely nuanced perspectives on the needs of their communities, knowing which areas are served by broadband and possessing demographic and socioeconomic insights that explain why some students lack high-speed access. 

These data sources are an encouraging start, but a challenge as urgent and complex as the digital divide demands additional layers of information and insight. Specifically, we must move beyond the people we already know (citizens who’ve completed their census forms, for instance, or people who’ve previously received vouchers for discounted internet service) and identify the broadband-needy people we don’t know and the messages most likely to motivate them to action.  

How data defeats the digital divide

A truly comprehensive and coordinated effort to bridge the digital divide begins with surveying the available data — the disparate sources that can collectively quantify the true scope of the work that must be done — and determining what information exists, as well as which pieces of the puzzle still must be unearthed.

“Is what’s out there useful? What granularity is it? When was it last updated? What are the possible biases? What is missing that could make it biased?” says Crystal Son, Civis’s head of data science communities. “The missing data in and of itself can be a data point. If your data is missing a chunk of information, it’s most likely biased in one direction or another, and you should try to know which direction that is.”  

The next step: bringing this data together in a centralized location, cleaning it to eliminate errors and redundancies, and securely sharing access among authorized stakeholders. The cloud-based Civis Platform boasts a multitude of connectors, Identity Resolution, and data appends features for importing, de-duplicating, unifying, and enhancing data, making it ready for analysis. Civis Platform enables organizations to identify the people they don’t already know about by leveraging their existing data, data that Civis brings to the table, and publicly-available government data sources like those cited earlier to build analyses and predictive models for finding and engaging outreach targets. 

These efforts guide the data-driven outreach campaigns to follow. Whether the focus is broadband connectivity, the U.S. Census, or vaccination against the COVID-19 threat, organizations need quantitative information and insights to power compelling, sustainable campaigns that speak loudly and clearly to the people that most need to hear the messages they’re sharing. 

Most public sector organizations usually have access to data to improve outreach, and most have staffers possessing some level of data analytics skills, but don’t often have the time and resources to combine these staffers with the data. With the right software and services, governments and their partners can efficiently and cost-effectively tap these resources to identify the people poised to benefit most from programs like the Infrastructure Investment and Jobs Act, and determine how, when, and what to communicate to this audience.

Knowing where to communicate is also crucial. Intelligence detailing which neighborhoods sit on the wrong side of the digital divide can guide the placement of out-of-home efforts like billboards trumpeting the imminent arrival of high-speed internet, but knowing where and how people prefer to engage more closely with this kind of information — e.g. SMS or direct mail — is vitally important to guarantee that messages reach the right people in the right place at the right moment in time. And in a melting pot like the U.S., where at least 350 different languages are spoken in homes across the country, it’s no less important to know which language will get the message across most persuasively.  

With $65 billion on the line, stakeholders are going to expect regular updates on how these Infrastructure Investment and Jobs Act-funded outreach campaigns are faring, and they’re also going to want detailed answers to their questions, too. Getting this data together is time-consuming, however, and not everyone has the data skills to get the job done right. Civis builds highly configurable software products so that the process of evolving from data-based insights to outreach action to outcomes runs smoothly and self-sustainably, making measurement another automatable step in the Platform workflow. Platform also offers data subscription services on digital divide outreach models, and makes it possible to distribute progress reports, ensuring that stakeholders get the information they need without slowing campaign progress. 

Progress isn’t slowing in Pharr, either. In late 2021, officials launched TeamPharr.net, delivering fiber optic internet services priced as low as $25 per month. At a groundbreaking ceremony for the project, Pharr Mayor Ambrosio Hernandez promised that broadband access will be available citywide within 12 months, and called on other communities in the Rio Grande Valley to follow Pharr’s lead. 
“It is our hope that, as we move forward and forge what we need to do, that the other cities would come along,” Hernandez said. “We are more than happy to share data. We are more than happy to partner with the neighboring cities. ​We can all come together.…let’s just do it, and make sure everybody wins.”

Young girl with hand raised taking class on a laptop

Civis Analytics offers a suite of tools and services to help organizations use data to understand and engage the hardest-to-reach populations.

Talk to an expert today