Skip to Main Content
Rishi Guharay
Rishi Guharay | Survey Scientist II, Civis Analytics

TL;DR: Survey participants are sometimes dishonest in their responses, inattentive while answering, or in a rush to get through the questions. This behavior is called satisficing. The following post explores how satisficing affects survey results, how Civis neutralizes its impact, and which measures must be taken to address increasingly poor respondent data quality.

Humans are fickle creatures. Regardless of our capabilities, oftentimes we just want easy-peasy, quick, and instantly gratifying tasks — including participation in survey research. Despite our best intentions and efforts, when asked a series of questions in quick succession, many of us engage in behaviors that reduce the mental effort needed to complete the survey. 

Unfortunately for survey researchers, this means that participants are sometimes dishonest in their responses, inattentive while answering, or in a hurry to get through the questions. These survey respondents ultimately provide poor-quality answers, which leads to poor-quality data, which leads to poor-quality insights. This behavior is called satisficing

Read on to explore how satisficing impacts the results of your survey efforts — and how Civis Analytics is innovating to mitigate the satisficer effect and more accurately determine the opinions of audiences.

Illustration of a group of surveys on a blue background with one of the surveys marked with a warning icon

What Is Satisficing?

Researchers have grappled with how to address satisficing* — i.e., the attempts that respondents make to get through a survey while reducing the mental burden of the survey process — since the inception of survey research and polling as means of collecting first-person data. 

When a respondent is satisficing, they employ certain shortcuts during the survey-taking process. These shortcuts can include: straightlining* through matrix (or grid) questions, speeding (or going extremely slowly) though the questions, answering randomly, or giving into social desirability* or acquiescence bias*. Either intentionally or unintentionally, they are putting in the minimum effort required to get through the survey and get that bread.

Satisfice, v.

Cognitive theory by Stanford professor Jon Krosnick states survey respondents take certain mental shortcuts to provide quick, “good enough” answers (satisficing) rather than carefully considered answers, also known as optimizing1

Note: Respondents who “optimize” must execute four stages of cognitive processing to answer survey questions optimally. Respondents must: 

  1. Interpret the intended meaning of the question 
  2. Retrieve relevant information from memory
  3. Integrate the information into a summary judgment
  4. Map the judgment onto the response options offered
Straightlining, v.

Survey behavior of ticking off the same option in a vertical line for all the questions in a matrix group of questions for expediency’s sake (e.g. choosing “somewhat agree” for every policy issue within a matrix asking about support for four different policies).

Social Desirability Bias, n.

The tendency to underreport socially undesirable attitudes and behaviors, and to overreport more desirable attributes.

Acquiescence Bias, n.

A tendency to select a positive or agreeable response option rather than sharing one’s true feelings. Also known as agreement bias.

Satisficing behaviors are further exacerbated by increasingly frequent participation in survey research, which is especially common among those who voluntarily opt in to participating in an online, non-probability based panel*.

These panelists* are in the habit of regularly taking surveys, and therefore even more likely to be fatigued by the survey process. Online panelists engage in satisficing behaviors at a higher rate than what researchers have historically observed among respondents in other modes of survey research, such as face-to-face interviewing and phone surveys. 

Although traditional polling methods are less likely to lead to satisficing, response rates in phone surveys have fallen dramatically over the past decade, leading to increasingly expensive and slow-to-field surveys. To adapt, organizations and research firms including Civis have turned to online panels or panel marketplaces* as their sample sources, requiring innovative and effective solutions to remove satisficers from the sample so we are able to provide accurate, high-quality data and insights to our partners. 

Civis’s state-of-the-art quota* and weighting* algorithms ensure that respondents match the population of interest along key demographic characteristics, giving you confidence in the inferences you make about your intended audience. Importantly, our extensively tested in-survey data quality checks ensure that only respondents who meet our quality standards complete the survey, guaranteeing the resulting data and insights are accurate, precise, and actionable.

Online Non-probability Based Panel, n.

A pool of respondents who have agreed to complete surveys via the Internet, made up of volunteers who were recruited online and who often receive some form of compensation for completing surveys, such as small amounts of money, gift cards, in-game points, or frequent flyer miles1.

The volunteer or “opt-in” nature of these panels differentiates these samples from probability-based panels, which recruit their members from randomly selected samples of street addresses, email addresses, telephone numbers, etc.

Panelist, n.

Respondent who chooses to consistently participate in online survey panels.

Panel Marketplace, n.

A consolidated panel provider that is composed of many different sources of panelists, with its own recruitment methods, respondent compensation standards, panel monitoring steps, and so on.

Quota, n.

The allocations for a set number of respondents within each subgroup (like gender, race, income, and education, or the cross-section of multiple of these subgroups) to ensure the survey is representative of the population of interest for the given research question. 

Civis uses a proprietary algorithm to generate “nested quotas,” rather than the marginalized quota “buckets” used historically in survey research. By using a precise combination of many different demographic characteristics to create these quotas (for instance, four people that are in a certain age bucket AND a certain race AND a certain education level), we acquire higher precision and more accurate demographic representation in our sample, compared to traditional quota buckets which create quotas on one characteristic at a time, such as gender or race.

Weighting, n.

The post-data collection process of adjusting datasets using a core set of variables, including demographics — like sex, age, race, and ethnicity, as well as educational attainment and geographic region — to correct any remaining imbalances between the survey sample and the population1 (even after the implementation of the upfront quotas). This is the final attempt to ensure representation in the survey, so the results can be properly and reliably applied to the entire population of interest.

web survey with a warning icon and correct and incorrect icons

How Civis Susses Out the Satisficers

Civis’s survey scientists, a team with backgrounds in survey methodology and experimental research, consistently test and implement novel ways of identifying these problematic respondents. At the time of this writing, we’ve tested a variety of measures of identifying and removing satisficers from online survey samples, including: 

  • Creating a module of trap* and attention check* questions to flag low-quality responses and immediately terminate those respondents from the survey
  • Identifying best-in-class question types to reduce acquiescence bias and improve response consistency* throughout the questionnaire
  • Experimenting with different warning messages to improve respondent attention and deter satisficing throughout the survey
  • Testing fun and encouraging messages throughout the survey to keep respondents engaged and reduce dropoff* rates
  • Examining the utility of paradata* like click count and question timing in identifying satisficers
  • Conducting a comparative analysis of data quality across panel providers

In addition to these in-survey factors, we regularly compare panel data quality so we can identify panels that send us a disproportionate share of satisficers — an essential step in improving data quality. This iterative process ensures that we are able to take actionable steps to block problematic panels from future samples, while allowing for the high-quality panels to send us more survey participants. We incorporate these findings into our survey templates so our data scientists always have ready access to the most up-to-date, rigorously tested, and methodologically sound ways to identify low-quality respondent data.

Trap Question, n.

A survey question embedded with some type of fake response, intended to catch satisficers who select an impossible or incorrect response option to the question — as a means of gauging respondent participation.

Attention Check, n.

A survey question with explicit instructions directing the respondent how to answer properly to “pass” the question. This helps to flag respondents moving inattentively throughout the survey.

Response Consistency, n.

A pattern of answer behavior that is consistently demonstrated over several moments in time, either at multiple points in one survey or across multiple surveys.

Dropoff Rate, n.

The percentage of respondents who entered the survey but did not complete it for many reasons (e.g. technical issues, lack of interest, irrelevant survey questions, the monotony of the survey, unclear purpose of the survey, etc.).

Paradata, n.

Data about how surveys are run and the process of collecting survey data or data sets (like click counts on each question, time taken to submit the response, or overall time spent on the survey).

Proof Points of Our Data Quality Measures

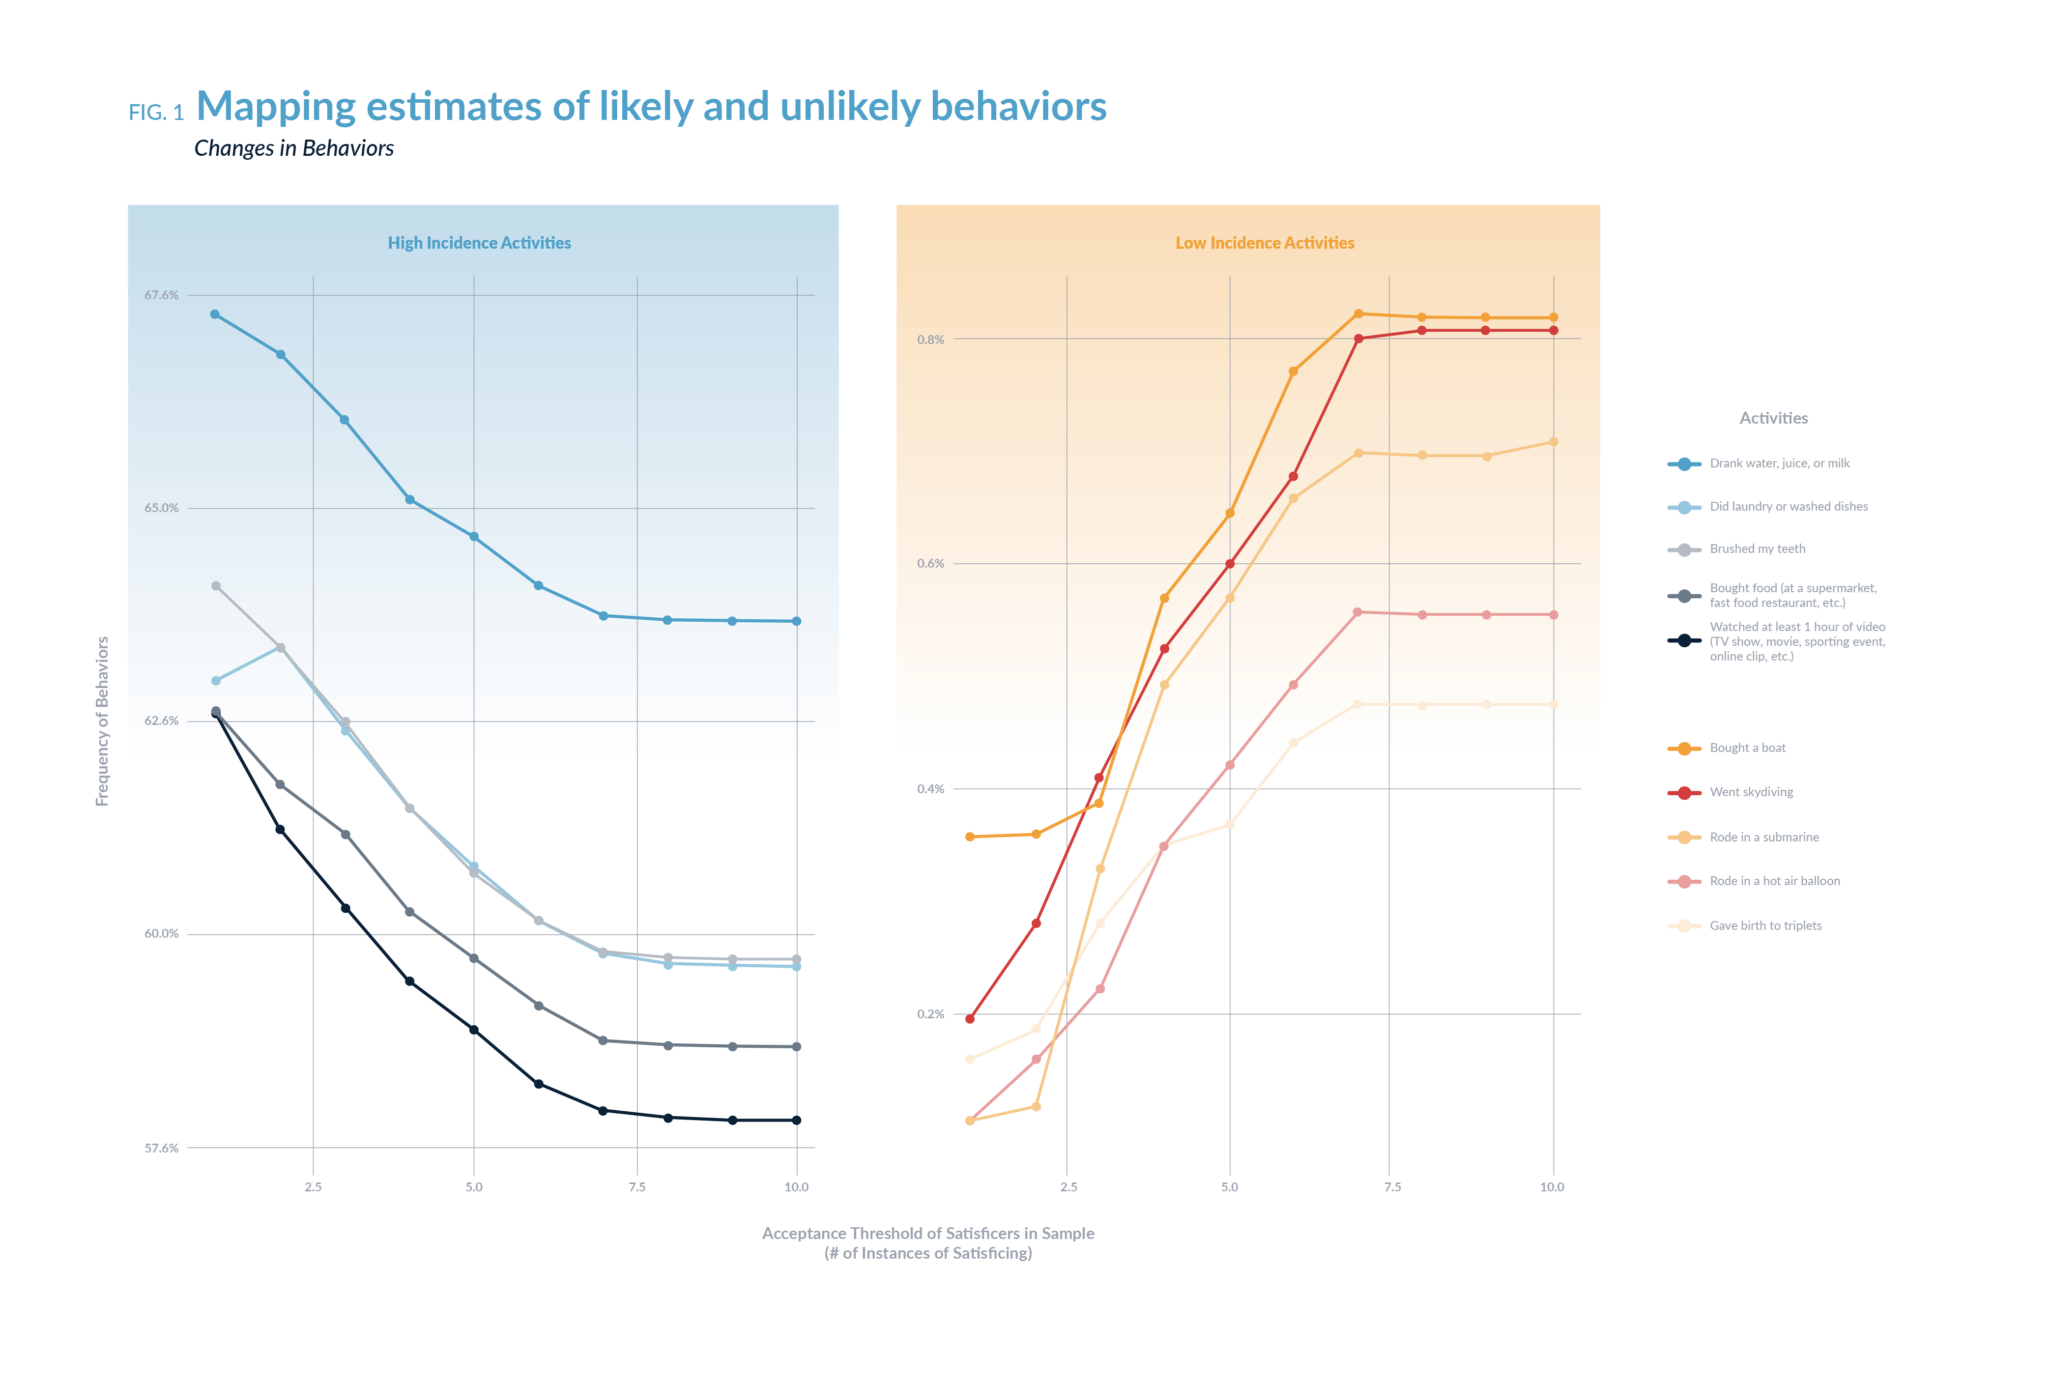
Figure 1: Mapping estimates of likely and unlikely behaviors

Figure 1 (above) displays a comparison of estimates for one of the satisficer-detection questions used in our data quality module and looks at how the sample changes when the people that we flagged as satisficers are removed from the dataset. The y-axis for this graph is the reported frequency of these behaviors in Question 1 (where we gauged participation in unlikely events), and the x-axis is our acceptance threshold for the satisficers in the sample. As the x-axis increases, we are more and more inclusive of satisficers in the survey. A score of 1 on the x-axis means that the resulting sample has excluded anyone who satisficed one or more times, and a score of 10 means that only those who satisficed 10 or more times were removed from the sample. 

The satisficing score, shown on the x-axis as the “Acceptance Threshold,” was determined by the number of times respondents satisficed during the survey. We used the assumption that high-incidence activities should have nearly a 100 percent incidence rate (IR), meaning that nearly everyone should have done these activities once over the course of the past 30 days, and conversely, the low-incidence activities should have close to a zero percent incidence rate, because most people would not have done these activities in the past month. (Please note that due to disabilities and other factors, it’s possible that some respondents might be outliers in how they responded to these questions; therefore, we use a threshold of two or more incorrect responses before we terminate respondents from the survey for satisficing.)

The plot on the left looks at the reported frequencies of high-incidence activities, like drinking water, milk, or juice, or watching an hour of video. The plot on the right looks at the impact on the reported frequencies of some of the low-incidence activities (like riding a hot air balloon or a submarine) when these satisficers are removed from the survey sample. 

As you see, as we are more inclusive with the satisficers in the survey, the reported frequencies of high-incidence behaviors decrease, and the low-incidence behaviors increase slightly. This demonstrates that the stricter we are with cutting off satisficers, the closer we get to measuring the true frequency of these behaviors. 

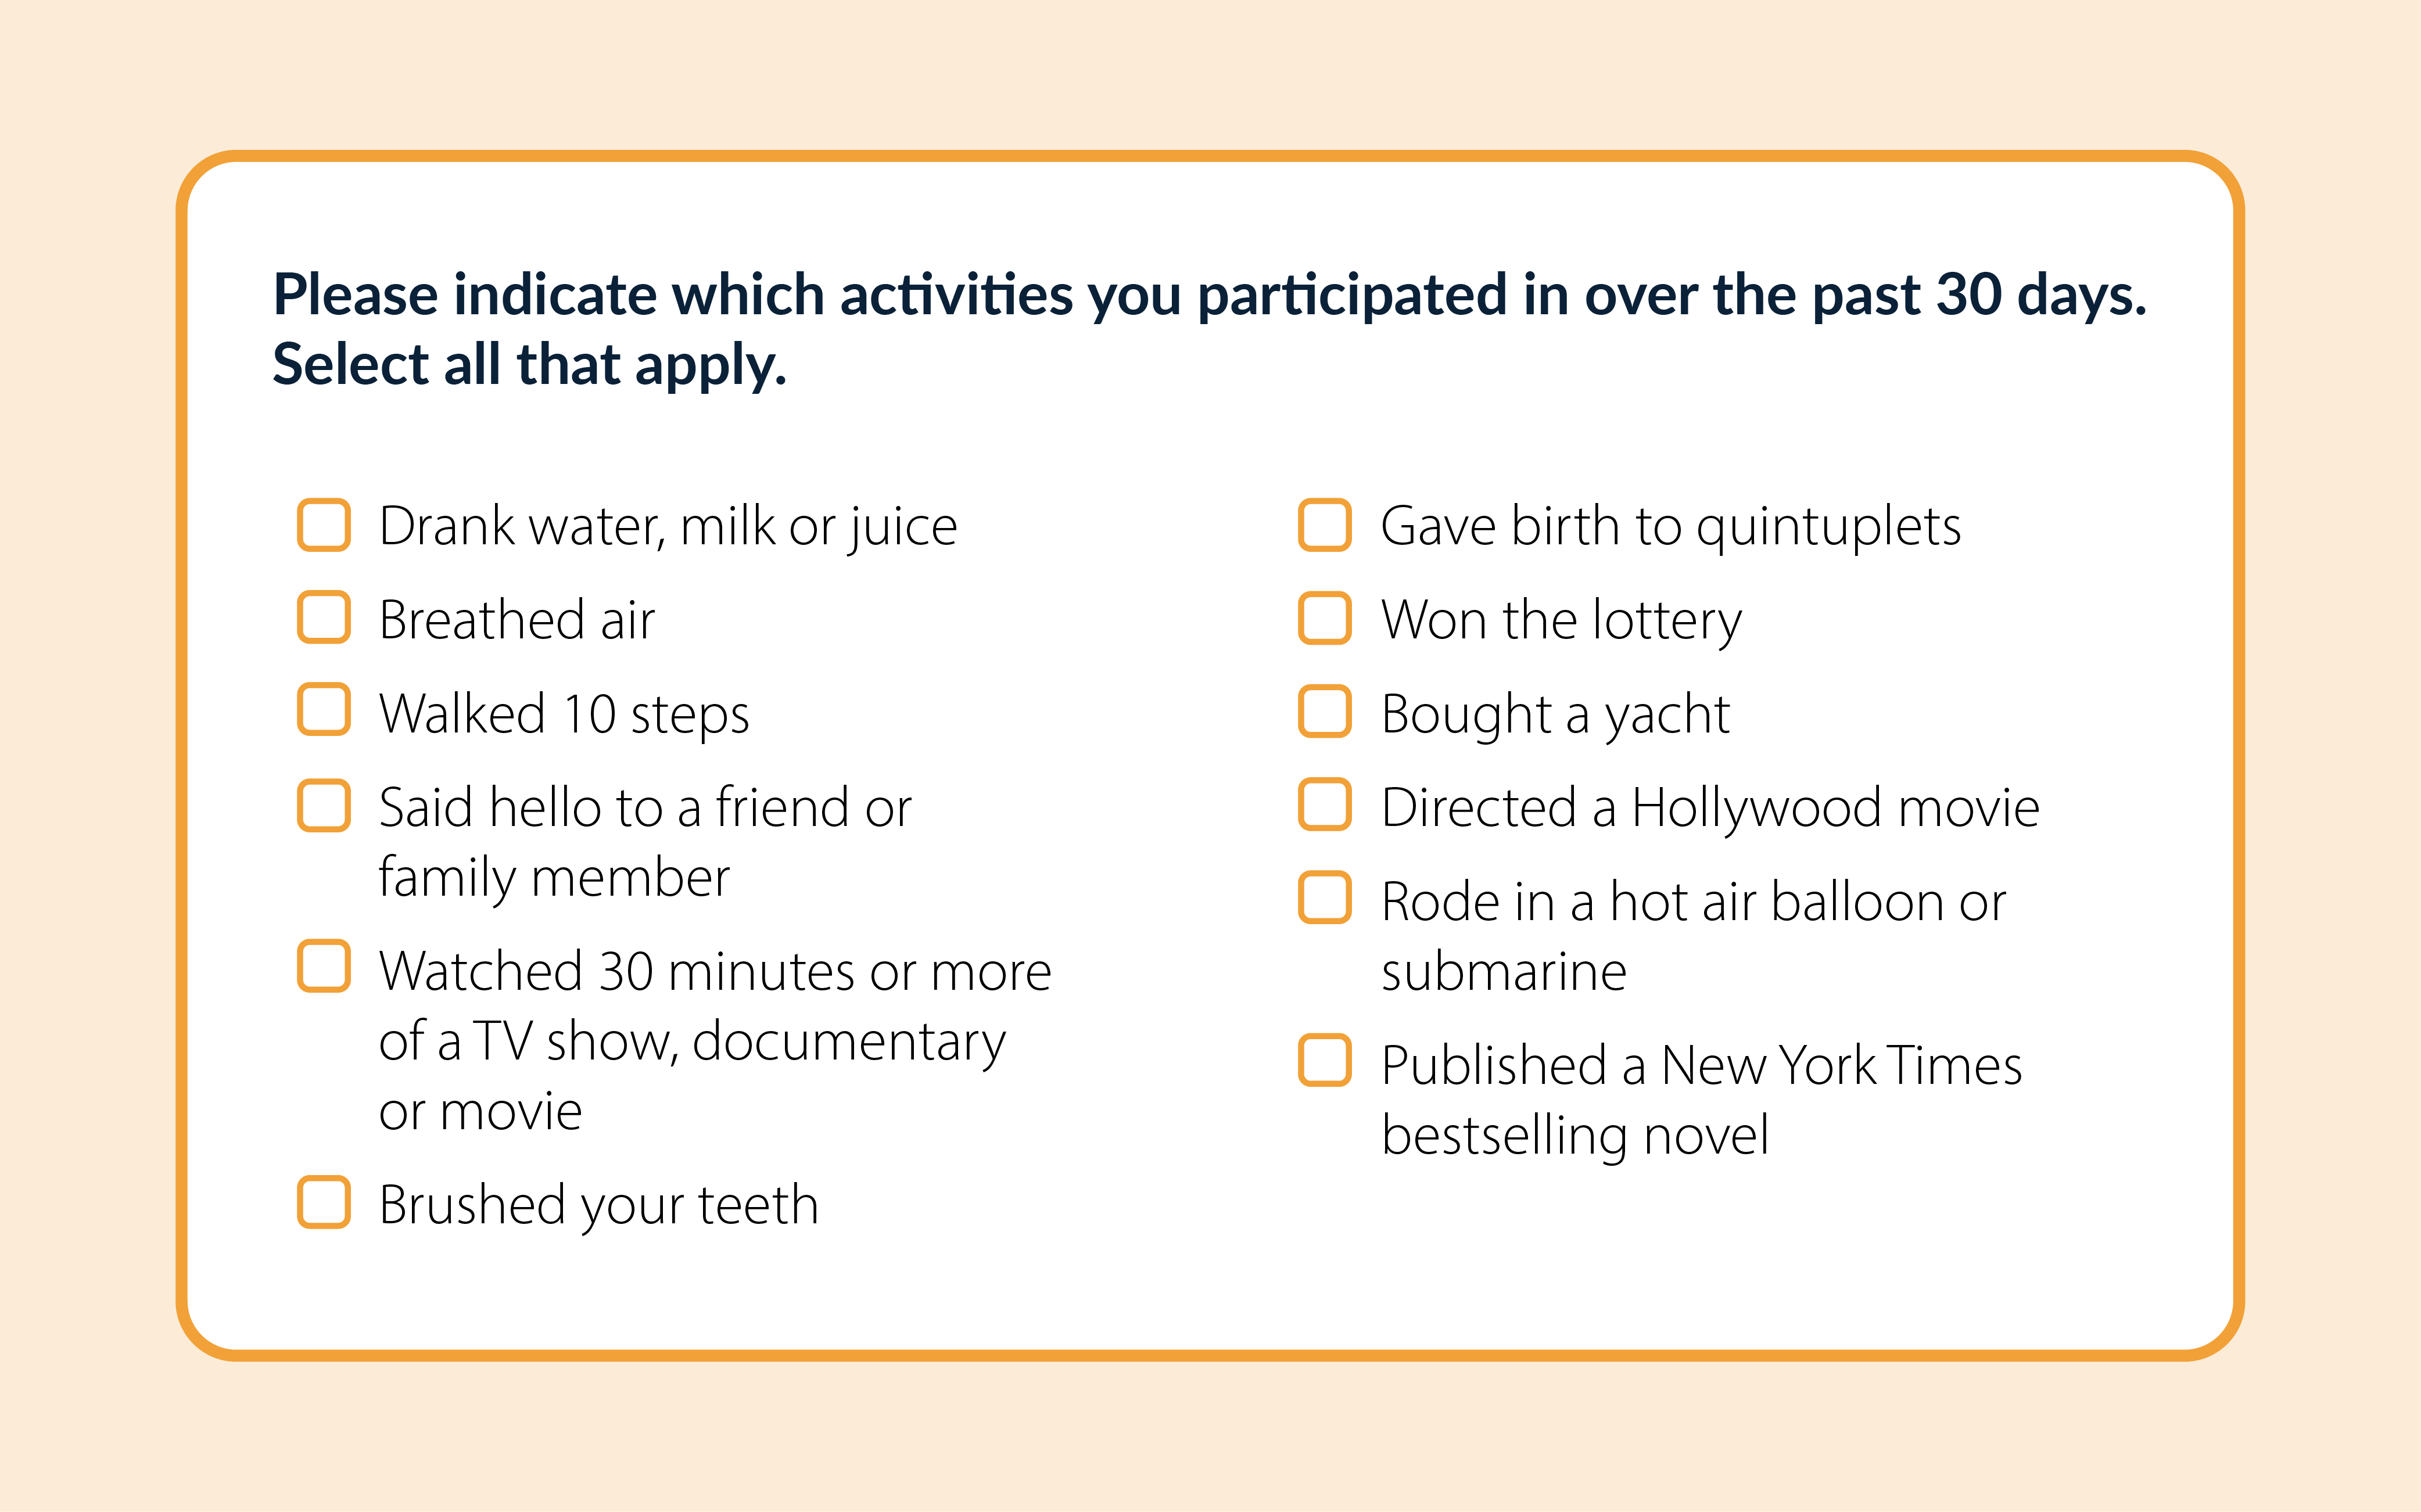
The question wording is as follows:

Please indicate which activities you participated in over the past 30 days. Select all that apply.
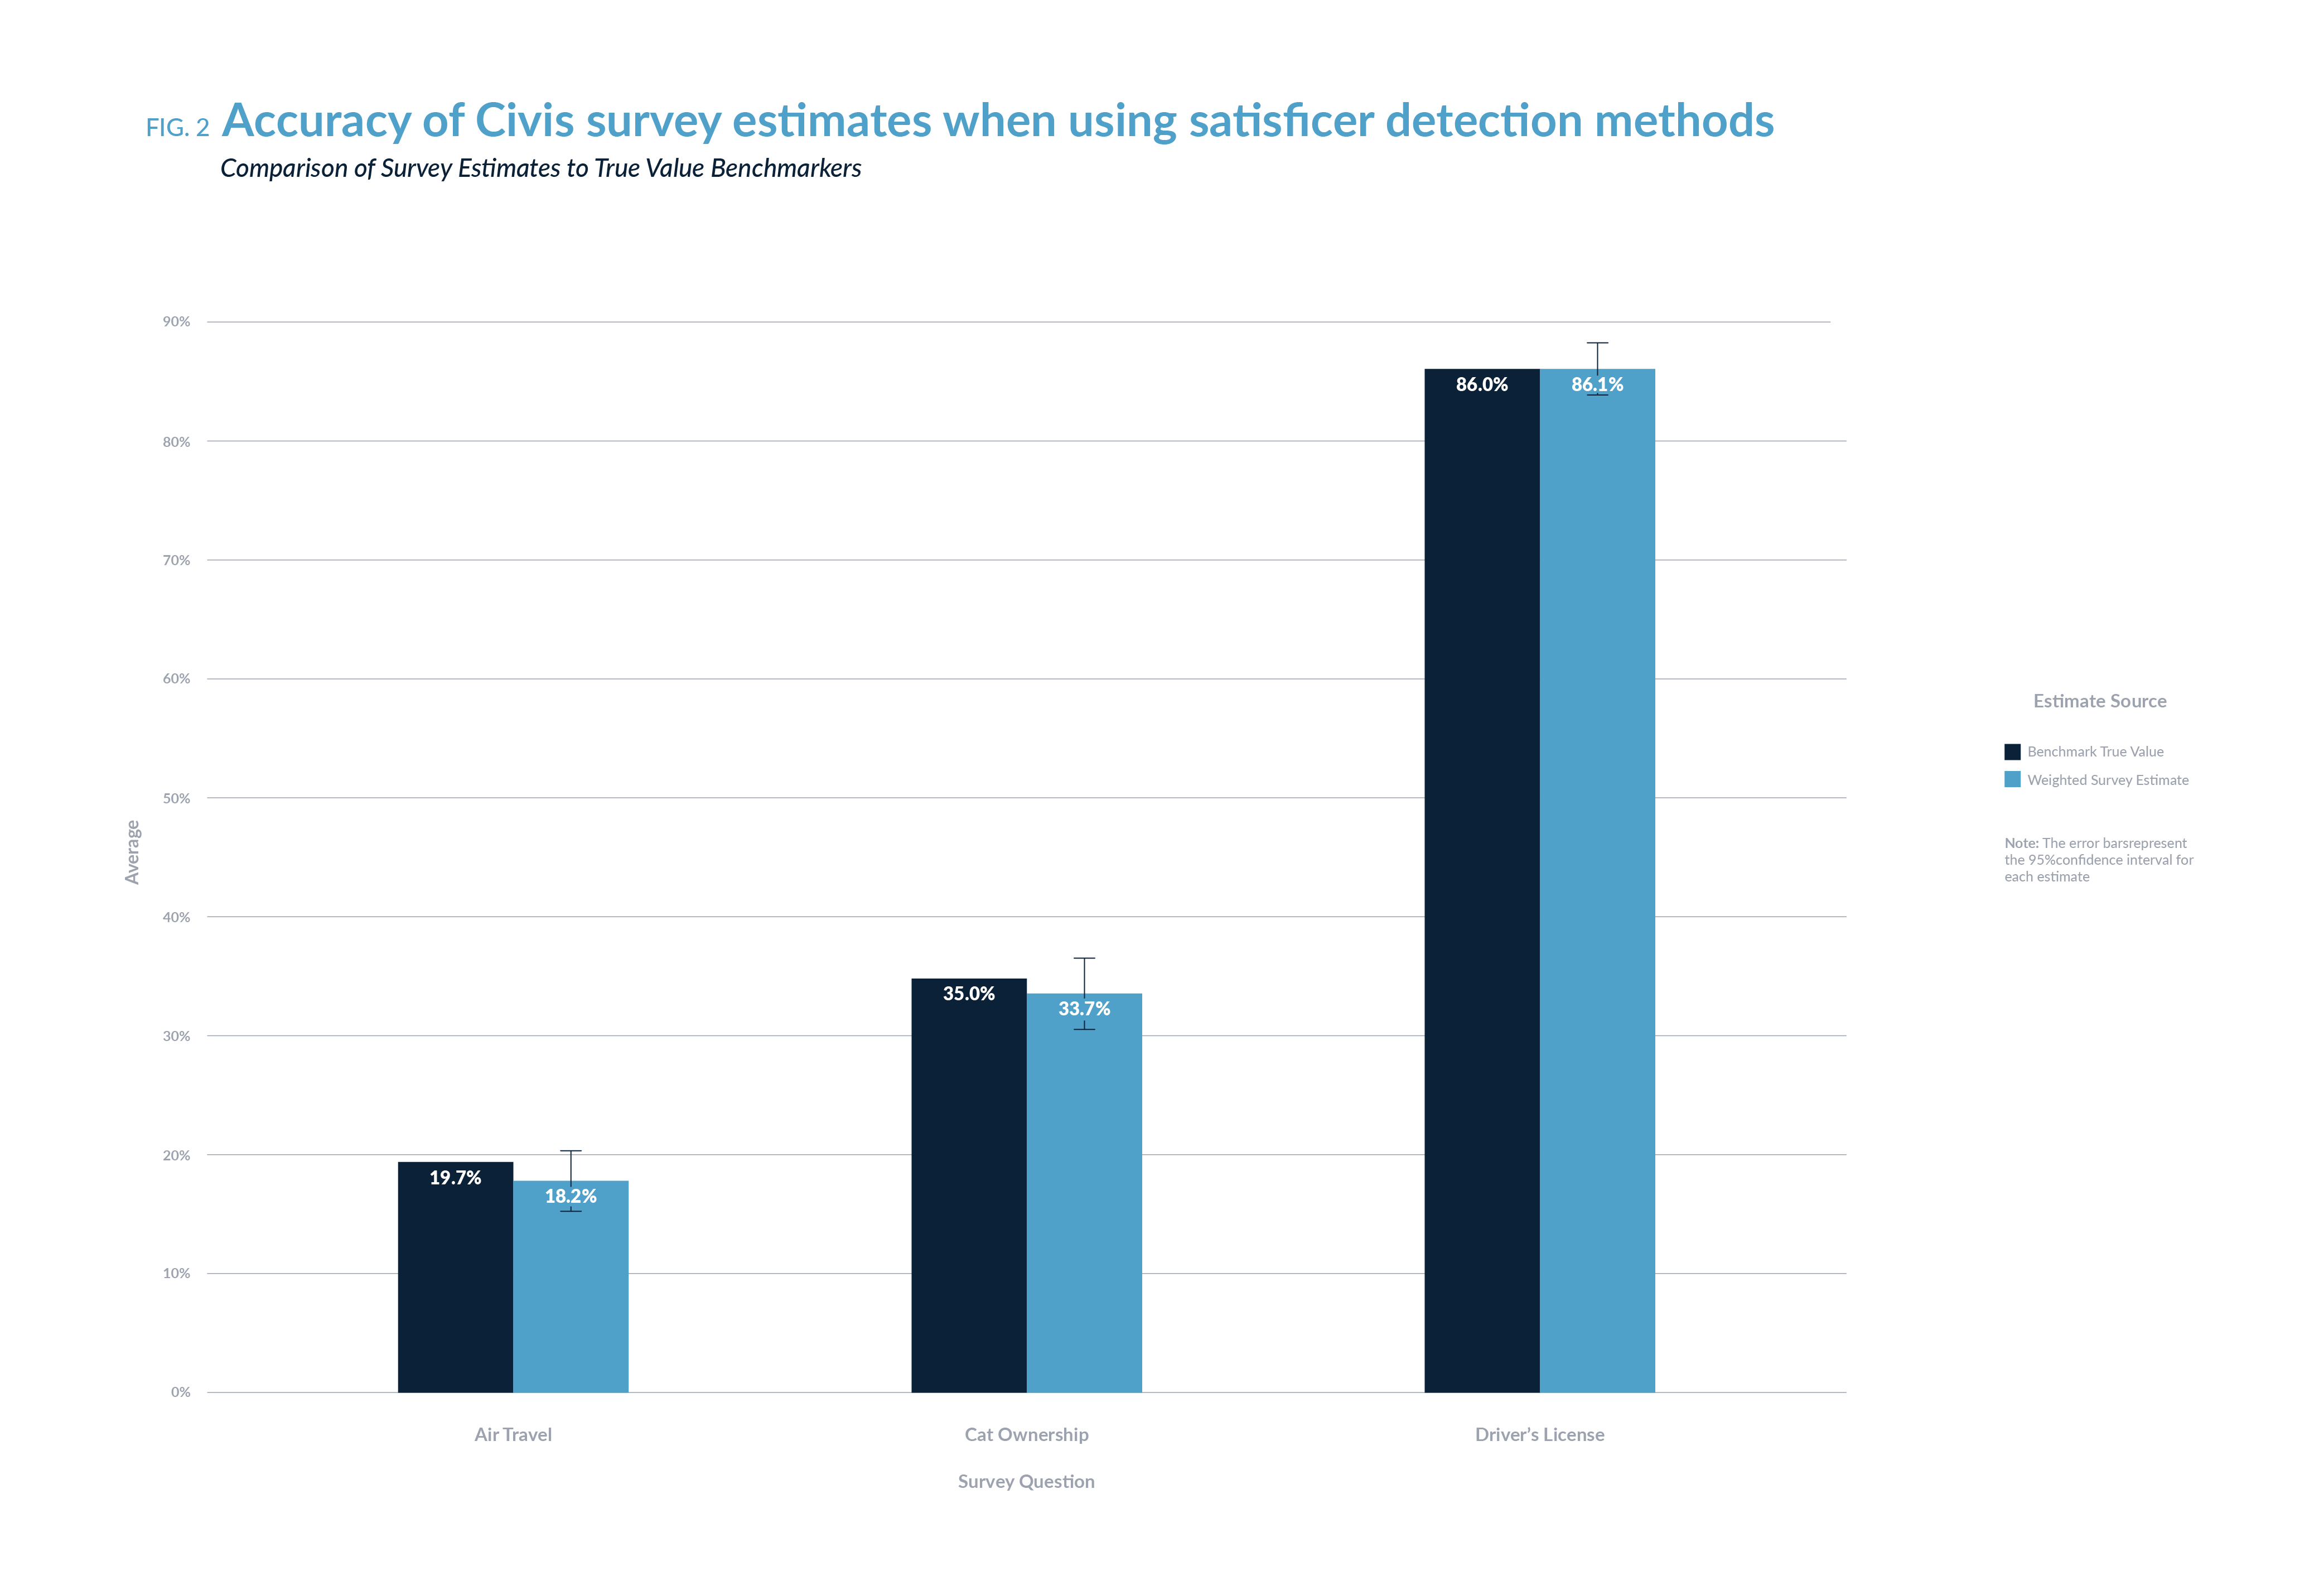
Figure 2: Accuracy of Civis survey estimates when using satisficer detection methods

We’re continuously testing and refining our methods, and one way to ensure we’re getting accurate results is to compare survey estimates to known, external benchmarks. To determine our level of precision, we asked a series of questions about a variety of topics that were asked on benchmark surveys or other creditable data sources. These questions included things ranging from cat ownership (whether or not the respondent owned a cat), driver’s license possession (whether or not the respondent had a valid driver’s license at the time of data collection), and airplane travel (whether or not the respondent traveled on a flight between October 2020 and November 2021).

After filtering out satisficers according to our standard process, we compared the weighted estimates from Civis survey questions to a known benchmark* for the same question (sources: TSA, Bureau of Transportation Statistics, ASPCA). These benchmark estimates were pulled from well-respected, high-quality tracking surveys, the values of which are often considered to be a “True Value” for these questions. For most of the comparison questions asked in the survey, our weighted estimates after the removal of poor-quality respondents were extremely close to the benchmarks!

Benchmark, n.

An external point of reference — typical from well-respected longitudinal tracking surveys, such as ANES (American National Election Studies), GSS (General Social Survey) — or first person behavioral data from reputable organizations, like the Centers for Disease Control and Prevention or the Bureau of Transportation Statistics. Benchmarks are used to compare survey estimates for validation and accuracy.

We noted that our satisficer checks contributed to the accuracy of our survey estimates in many of these questions, with the confidence intervals of our estimates often containing the True Value. Even for the estimates that didn’t fall within the confidence interval of the True Value, filtering out satisficers from the sample always got us closer to that estimate.

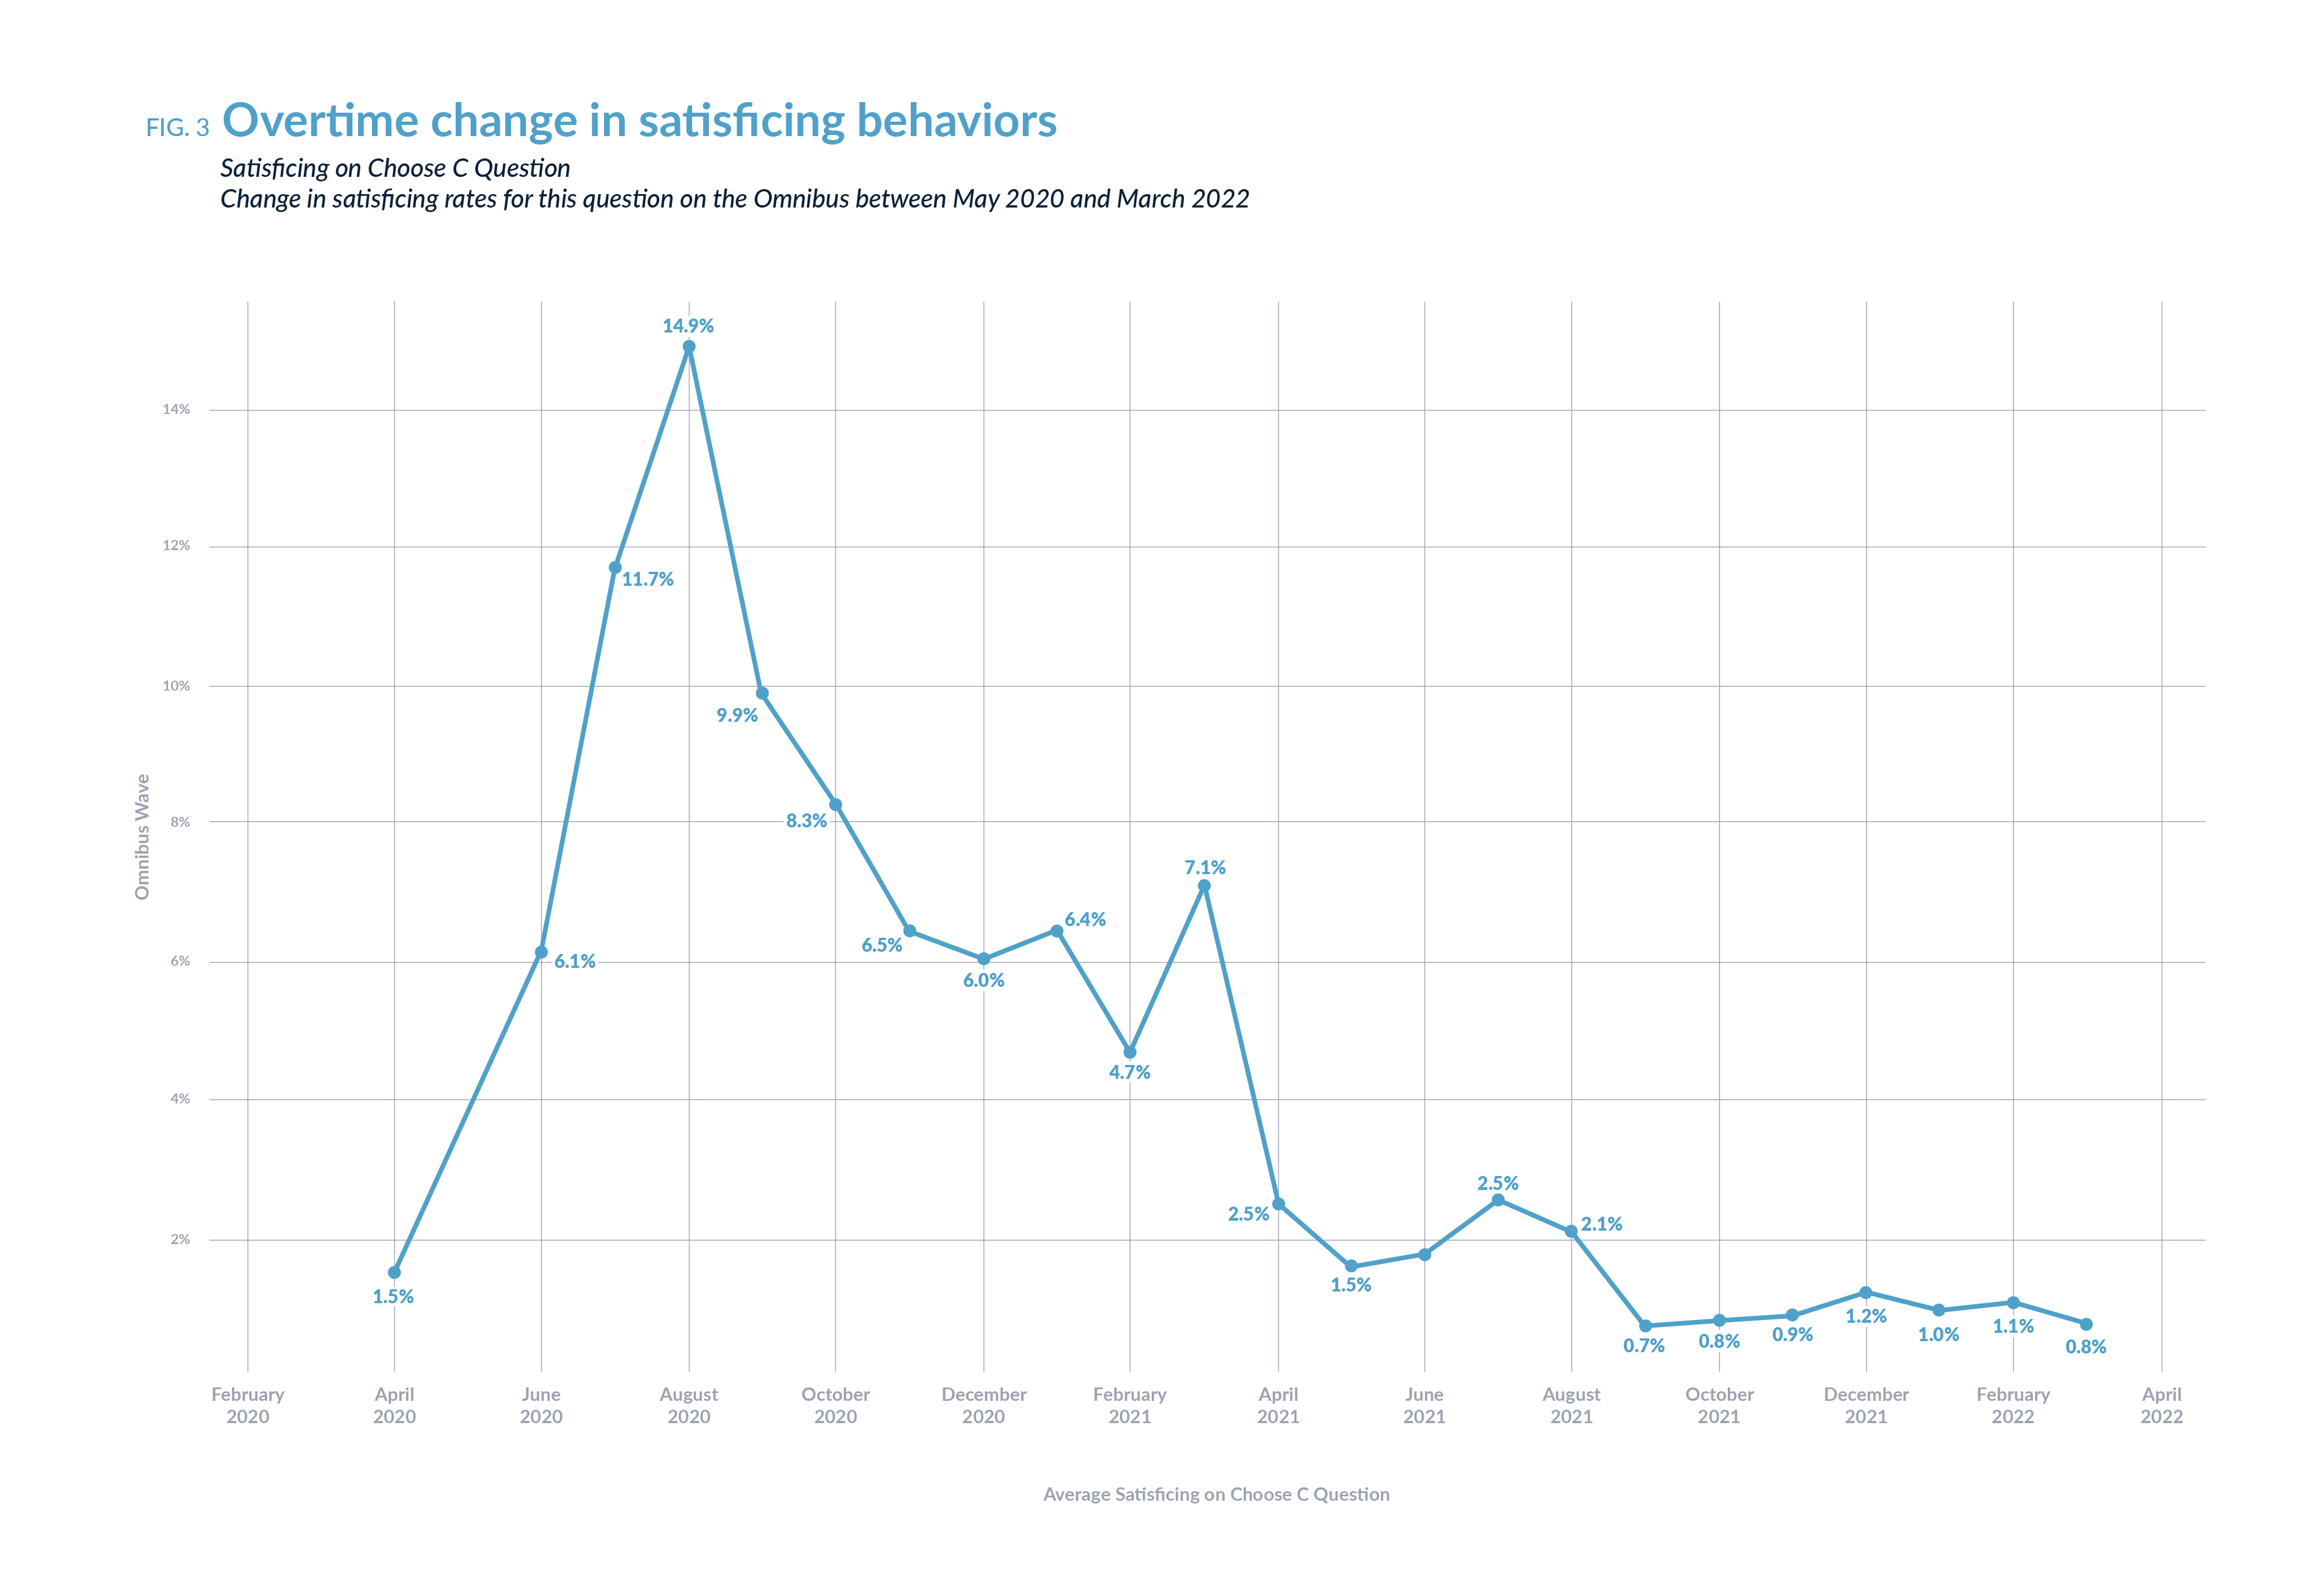
Figure 3: Overtime change in satificing behaviors

Satisficers will learn and adapt to the questions being asked in a satisficer-detection module, particularly those who participate in online panels and engage frequently with surveys. Figure 3 demonstrates this concept for one of the questions in our module — a simple attention check question that instructs the respondent to choose the response option “C” in a randomized, multiple choice list of four letters. 

However, despite the simplicity of this question, we see that at the peak, nearly 14 percent of respondents in the sample answered incorrectly. Although there are some peaks and troughs in average satisficing over the first half of the waves, after March 2021 we see a definitive decrease in average satisficing on this question. This demonstrates that over time, savvy satisficers will learn to recognize these questions and adapt their behaviors. We recommend regularly checking on average rates of satisficing, and changing your satisficer-identification methods and questions when necessary in order to continue properly flagging poor respondents.

Note: This data was pulled from Civis’s “always-on” tracking survey, the Omnibus, which runs weekly waves of surveys (including the satisficer-detection module) with a sample size of about 2,000 people per wave. The tracking survey began in May 2020, so this data includes respondents from every wave from that time through March 2022.

For Figure 3 (above), every survey from the four waves of the Omnibus fielded were consolidated into monthly waves.

illustrations of paper surveys, web surveys, and a science beaker

What Civis Has Learned About Satisficing

During this experimental process of finding the most effective satisficer-detection module for survey research, we’ve learned many important lessons about the world of survey respondents and the measures necessary to address increasingly poor respondent data quality. 

First and foremost, we’ve learned that there will always be people who are engaging in these types of satisficing behaviors regardless of the data collection mode used for the research, although it is more common in some modes of data collection than others. Since satisficing behavior is endemic to survey research, researchers should ensure the survey is designed succinctly, simply, and engagingly to foster respondent attentiveness and accuracy throughout the survey. 

Expecting perfection and full attention from respondents is proving to be more and more unattainable. But employing effective warning messages and motivational messages, in addition to well-tested satisficer-detection questions, can go a long way towards meaningfully improving data quality. By remaining vigilant about data quality and designing simple, engaging surveys, we can deliver precise, accurate, and representative insights to our clients and partners. 

Additionally, this research highlights the importance of constant experimentation around methods of identifying low quality respondents, and the importance of regularly updating these findings. Satisficers are savvy! Survey respondents adapt and find new ways to “game” the survey system, and get around outdated versions of data quality checks. Panels are continuously recruiting new participants into their panels, so the quality of their data is also subject to changes based on these uncontrollable recruitment methods and respondent composition. 

Regularly investigating the quality of data from panel providers is essential to ensuring that you are making informed decisions on the composition of your sample, as is only using panels that send high-quality respondents to your surveys. This iterative process ensures that we never accept a one-and-done solution to a constantly changing problem. We encourage organizations to conduct similar experiments on their samples to determine what works best in their particular field, and to continue to do so regularly, since respondents will never stop shifting and adapting to outdated checks. 

Lastly, we found that knowledge sharing is crucial as we determine even better methods for identifying poor-quality respondents. We hope other organizations apply our findings and insights to address similar concerns about data quality in their data collection modes. 

Civis researchers have presented many of the findings cited here at survey conferences such as AAPOR and MAPOR; disseminated this information to partners and clients; and externally documented much of this research to audiences like you through posts like this. Transparency and open lines of communication across organizations are key factors in ensuring that research teams are up to date on the most recent findings in this field, giving audiences deep trust in the accuracy and quality of our survey research findings.

Collaboration and transparency, regularly adapting our research methods, prioritizing respondent experience, and constantly learning about the novel methods implemented at other organizations help us combat quality concerns and produce accurate research and insights. We encourage you to reach out to us with any questions, concerns, or suggestions about identifying low-quality respondents.