
From Data Question to Board-Ready Visualizations in Minutes: How Civis' SQL AI Assist Transforms Data Analysis
As data becomes increasingly central to decision-making, organizations need tools that make data analysis accessible to team members across all technical skill levels. Whether you're preparing for a board meeting or need quick insights for strategic planning, the ability to rapidly transform raw data into compelling visualizations can make all the difference.
Today, I want to walk you through a powerful combination of features in Civis Platform that exemplifies this democratization of data: SQL AI Assist paired with our SQL Reporting tool. These features work together to help you move from a simple question about your data to professional, presentation-ready visualizations—all without needing to be a data science expert.
The Challenge: Quick Analysis for High-Stakes Presentations
Let me paint a familiar scenario. You're working at a non-profit organization, and your board meeting is approaching. You need to show how your Event and Year-End fundraising campaigns have performed over time. The data exists in your database, but transforming it into a clear, compelling visualization typically requires:
- Writing complex SQL queries
- Manually formatting the results
- Using separate visualization tools (e.g., R Python, Tableau)
- Potentially involving multiple team members or departments
With Civis Platform, this entire workflow can be completed by a single person in just a few minutes.
Natural Language to SQL: The Power of AI Assist
The journey begins in Civis Platform's Query tool. Instead of writing SQL from scratch—which can be intimidating for non-technical users or time-consuming even for experienced analysts—you simply describe what you want in plain English.
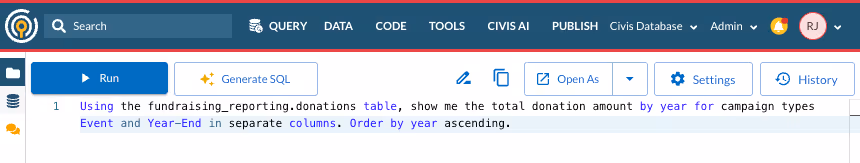
For our fundraising analysis, the prompt is straightforward: "Using the fundraising_reporting.donations table, show me the total donation amount by year for campaign types Event and Year-End in separate columns. Order by year ascending."
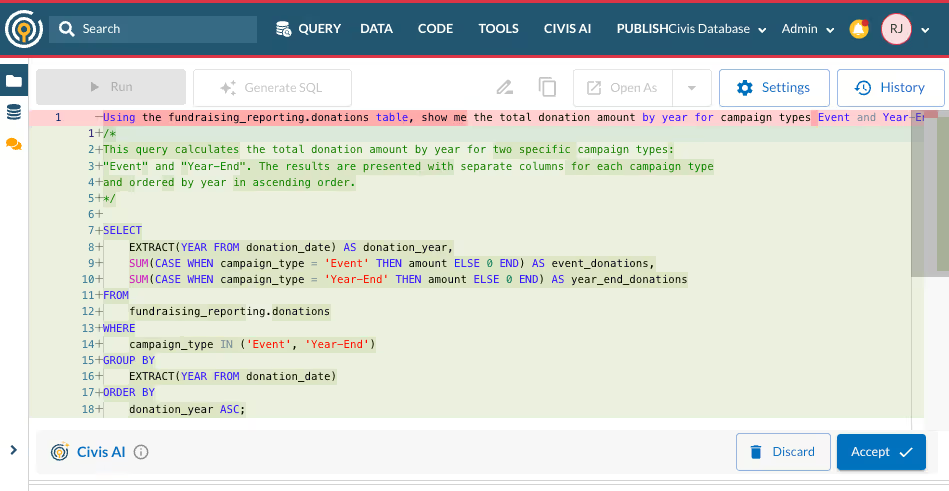
With a single click of the 'Generate SQL' button, SQL AI Assist analyzes your table’s metadata and generates the exact query you need. No syntax to remember, no joins to figure out—just describe your data needs and let the AI handle the technical translation.
Instant Results, Immediate Insights
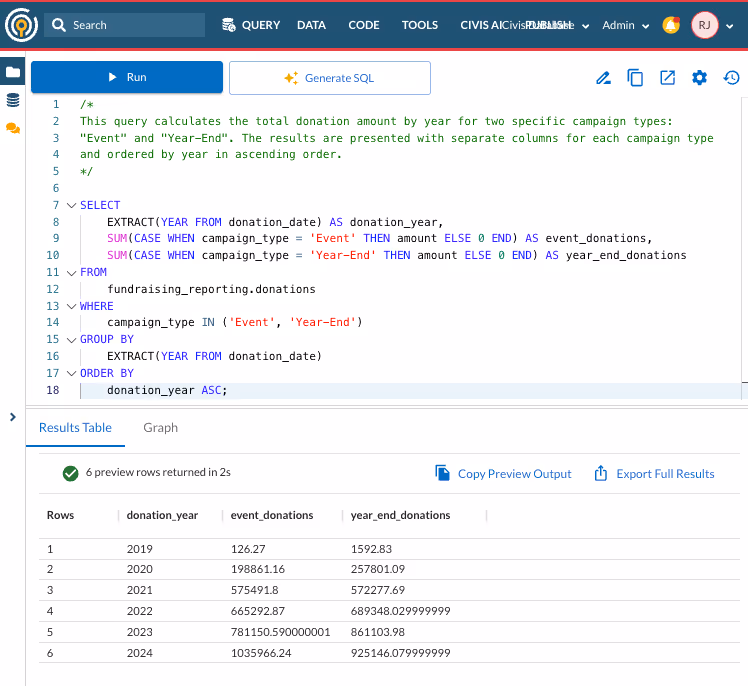
Running the generated query immediately reveals the data pattern: donations have increased year-over-year, with 2019 showing substantially lower donations than subsequent years. This is valuable information, but numbers in a table don't always tell the most compelling story, especially for a presentation.
From Data to Visualization: The Seamless Transition
This is where Civis Platform truly shines. Without leaving the query pane or exporting to another tool, you can transform your query results into professional visualizations with just a few clicks.
The Graph feature, in Civis Platform’s query tool, offers multiple visualization options:
- Bar charts (perfect for our comparison needs)
- Line charts (ideal for trends over time)
- Scatter plots (great for correlation analysis)
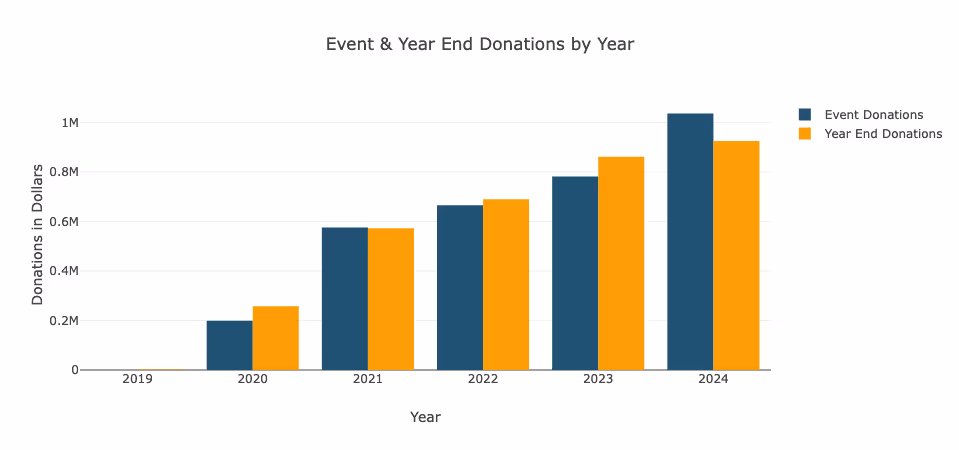
For our fundraising comparison, a grouped bar chart provides the clearest visual story. The platform intelligently recognizes your data structure, automatically placing years on the X-axis. Adding both Event and Year-End totals to the Y-axis creates a comprehensive view of your fundraising performance.

Professional Polish Without the Design Degree
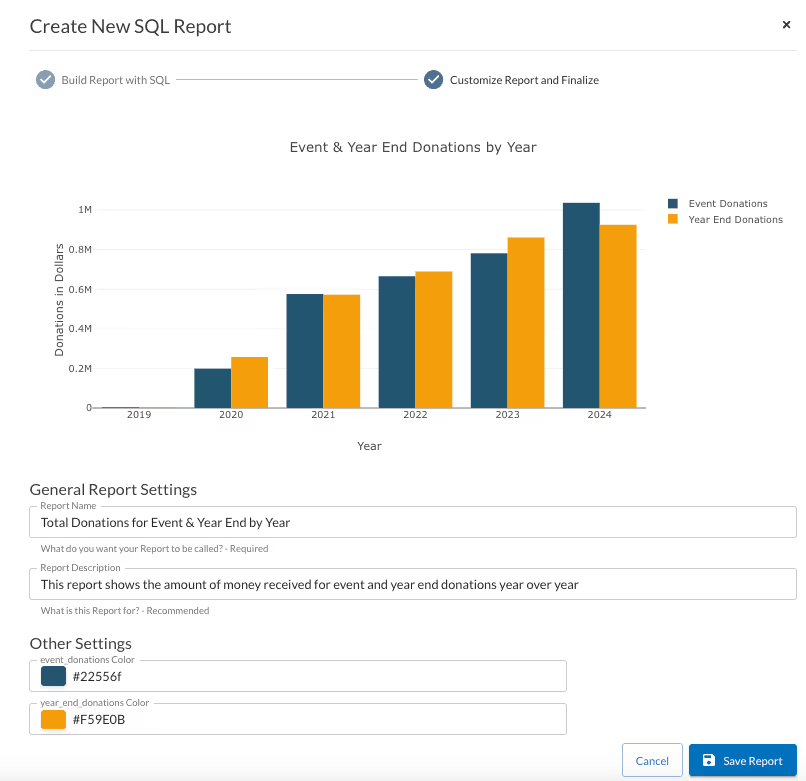
The SQL Report feature takes your visualization to the next level. When you open your query as a SQL Report, you can:
- Customize titles and axis labels for clarity
- Adjust legend labels to match your organization's terminology
- Choose colors that align with your brand or presentation theme
- Fine-tune every aspect of your visualization for maximum impact
These aren't just cosmetic changes—they transform a basic chart into a professional, presentation-ready visualization that clearly communicates your message.
Share, Save, and Collaborate
Perhaps most importantly, your work doesn't disappear when you close your browser. Civis Platform’s SQL Reports allow you to:
- Save reports for future reference or updates
- Share visualizations with team members
- Organize reports within projects
- Export as PNG files for presentations and emails
- Create living reports that update as your data changes
This means the analysis you create for today's board meeting becomes a reusable asset for next quarter's review.
The Bottom Line: Democratizing Data Analysis
What once required a team of analysts and designers can now be accomplished by anyone in your organization who understands their data needs. SQL AI Assist removes the technical barrier of query writing, while SQL Reports eliminate the need for separate visualization and reporting software.
The result? You can go from a question about your data to a polished, shareable visualization in minutes, not hours or days. This isn't just about saving time—it's about empowering every member of your organization to leverage data for better decision-making.
Whether you're preparing for a board presentation, writing an email, or creating a report, Civis Platform's combination of AI-powered SQL generation and integrated visualization tools puts the power of data analysis directly in your hands.
Ready to transform how your organization works with data? The journey from question to insight has never been shorter.